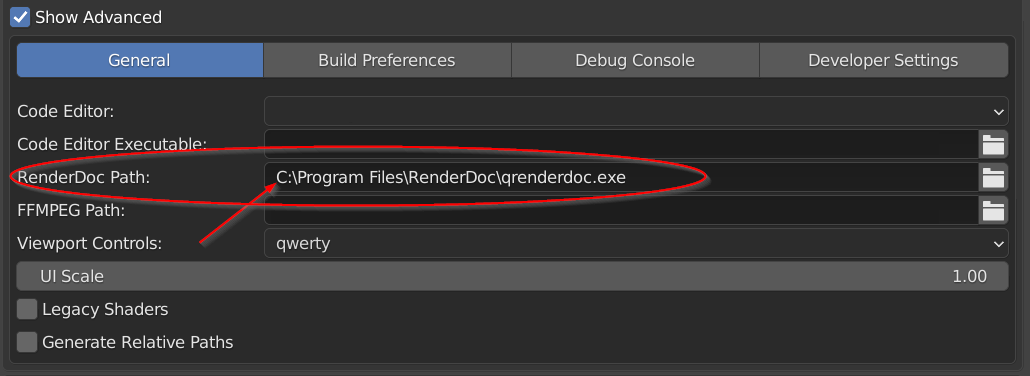
Can someone tell me what is the use for the RenderDoc field in the Armory Blender Addon-on preferences settings ? See below :
When setting up the file location for RenderDoc, does a button or functionality appear in the Armory Blender UI ?
EDIT : Nevermind : I found it
I had to click on the down arrow ‘v’ in Blender below the Publish button on the right-hand side.
It says ‘Open in RenderDoc’.
What is it used for ?
1 Like
Yes, it’s a bit hidden but it’s only meant for debugging purposes. RenderDoc is a graphics debugger that allows you to inspect what happens on the GPU in a captured frame of your game. You can see what draw calls are made and what rendertargets are used and you can even step debug through shaders, although the functionality of this is limited (I think it’s due to the way GPUs work). It can help you a lot when you need to know what is going on.
There are also other noteworthy graphics debuggers like Intel GPA or Nvidia Nsight, but there is no Armory interface for them. Nonetheless it might be useful (if you are into graphics programming) to have a few different debuggers as they have different strengths. Intel GPA for example lets you edit the shader code and re-runs the captured frame.
For access to the non-assembler source code inside of the debuggers you might need to enable Set Khamake Flag: --debug in the Armory preferences under Developer Settings. I added a note for it on the debug wiki page.
3 Likes
with Set Khamake Flag: --debug
it looks like there is more info in RenderDoc.
I just tried intel GPA, great tool Thank you 
better than Spector.js
2 Likes